A Look at Hurricane Milton
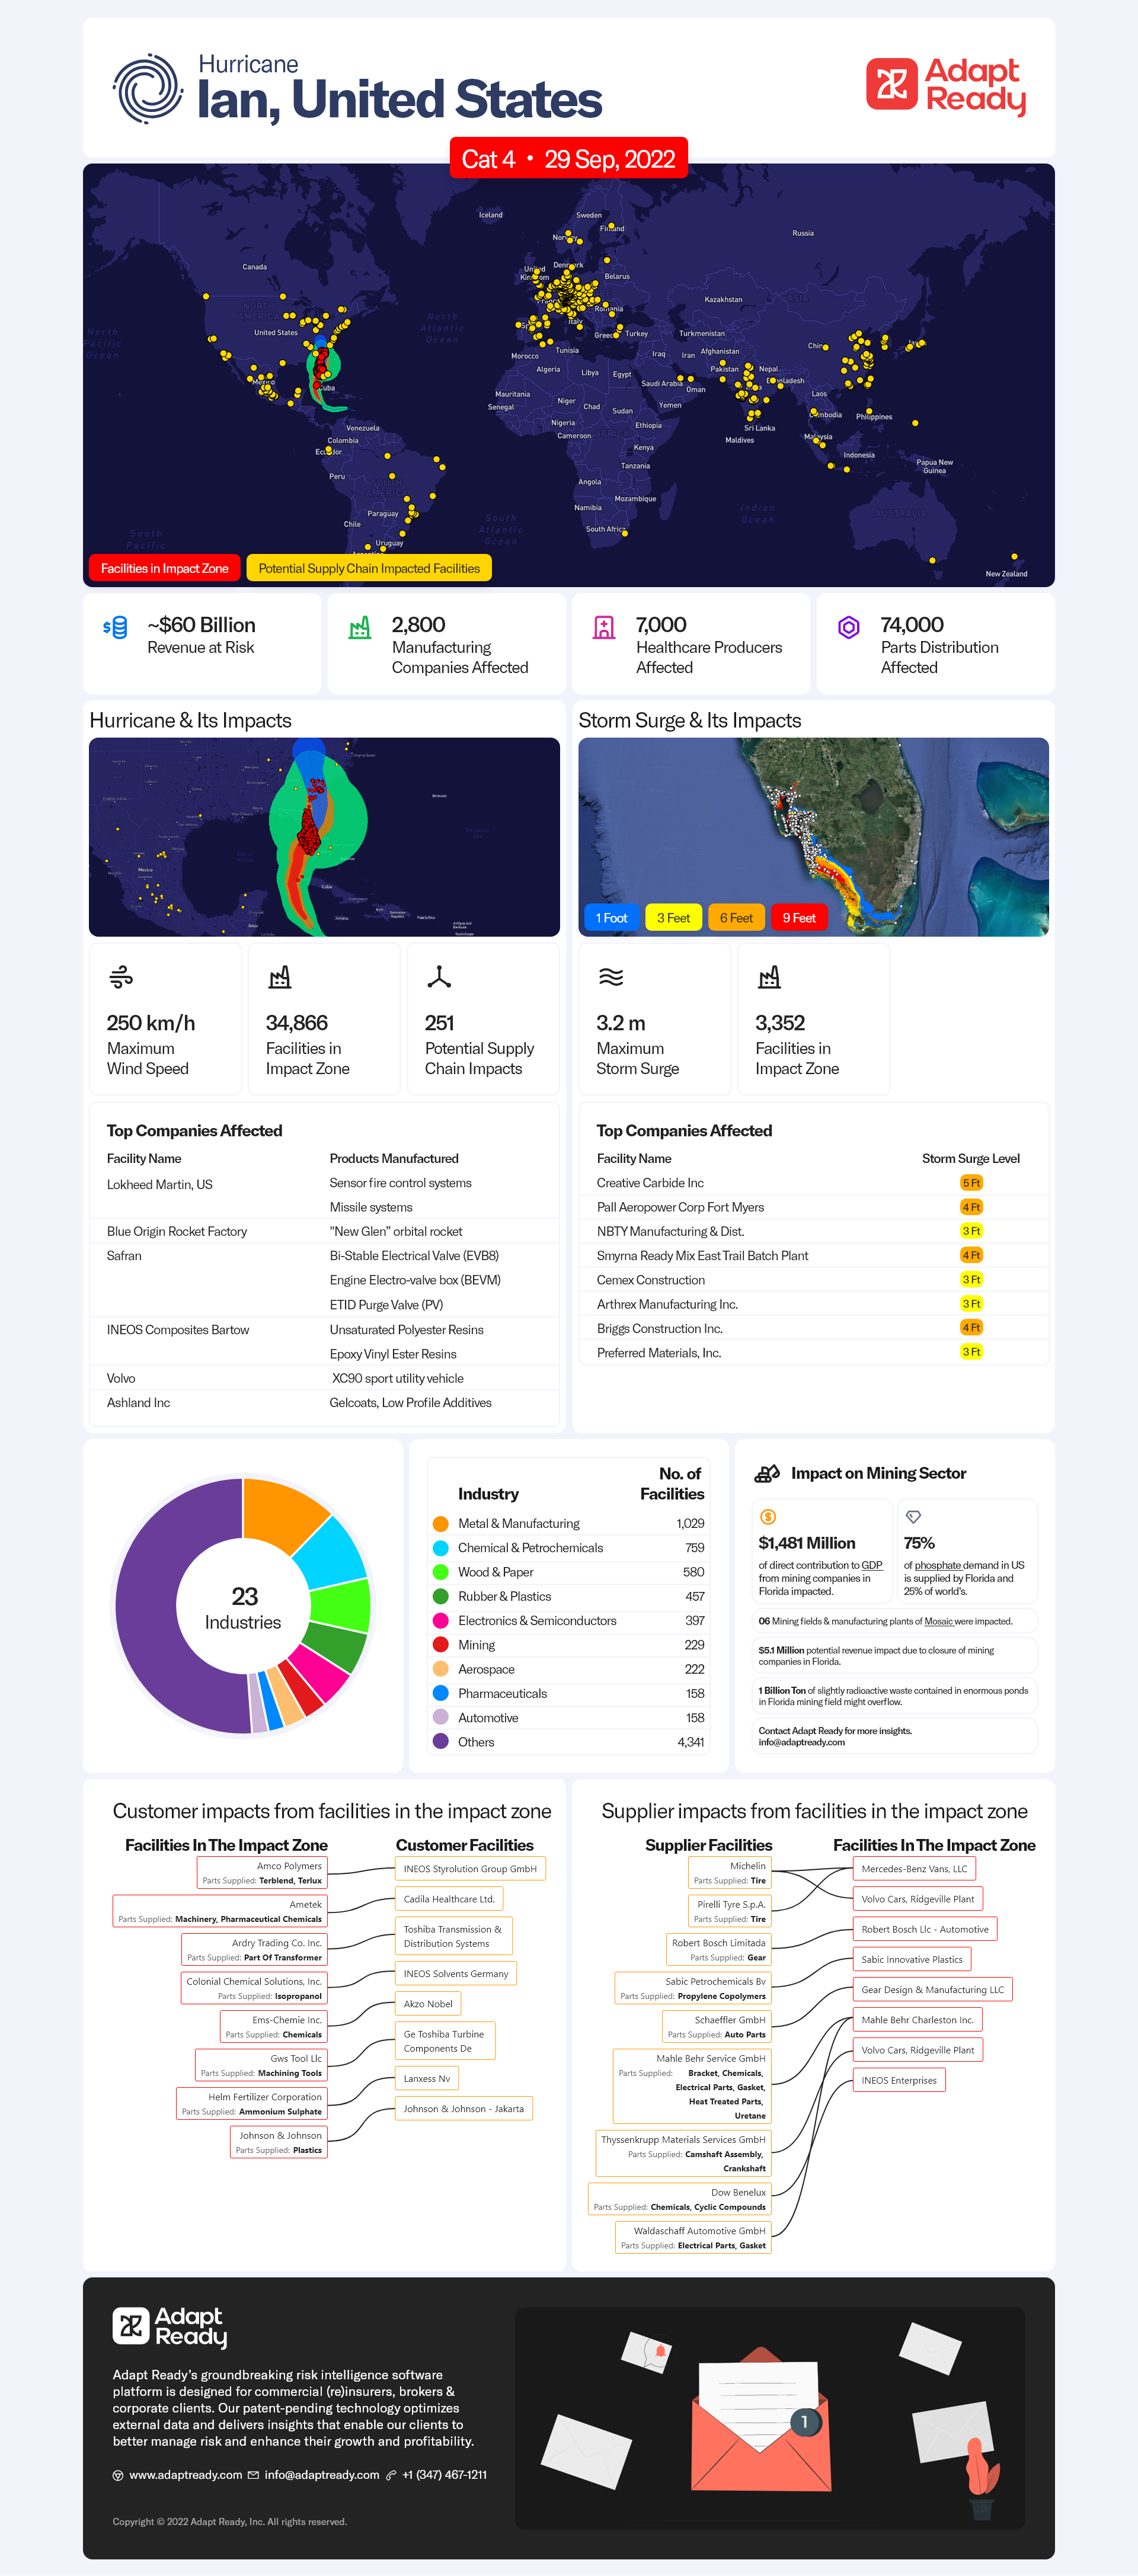
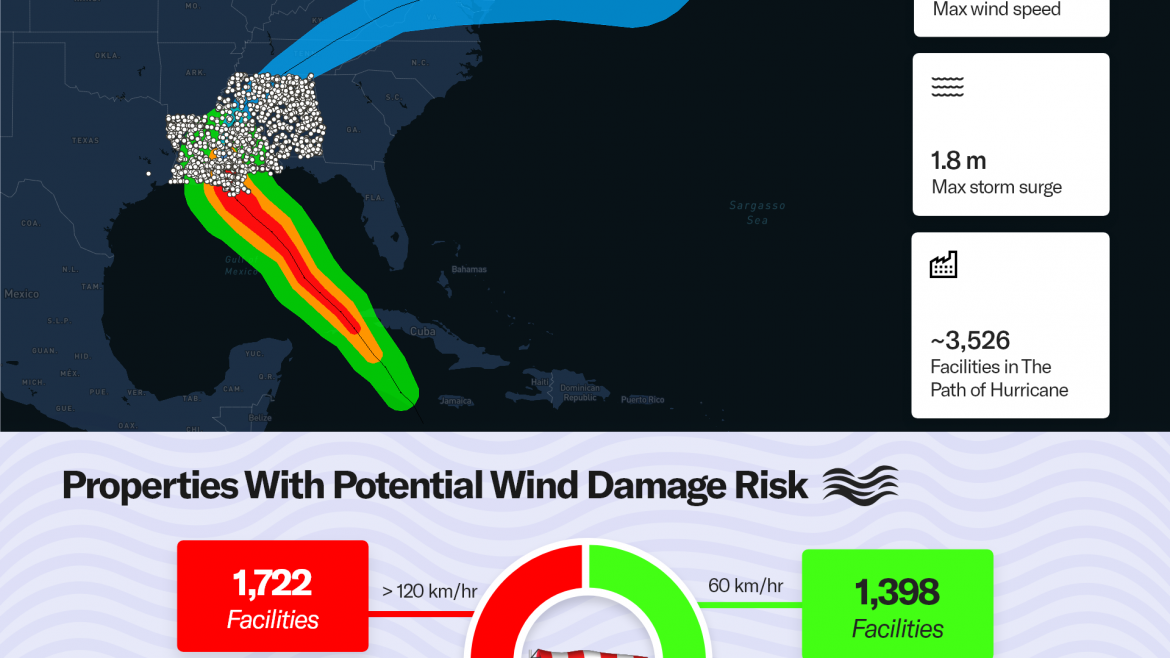
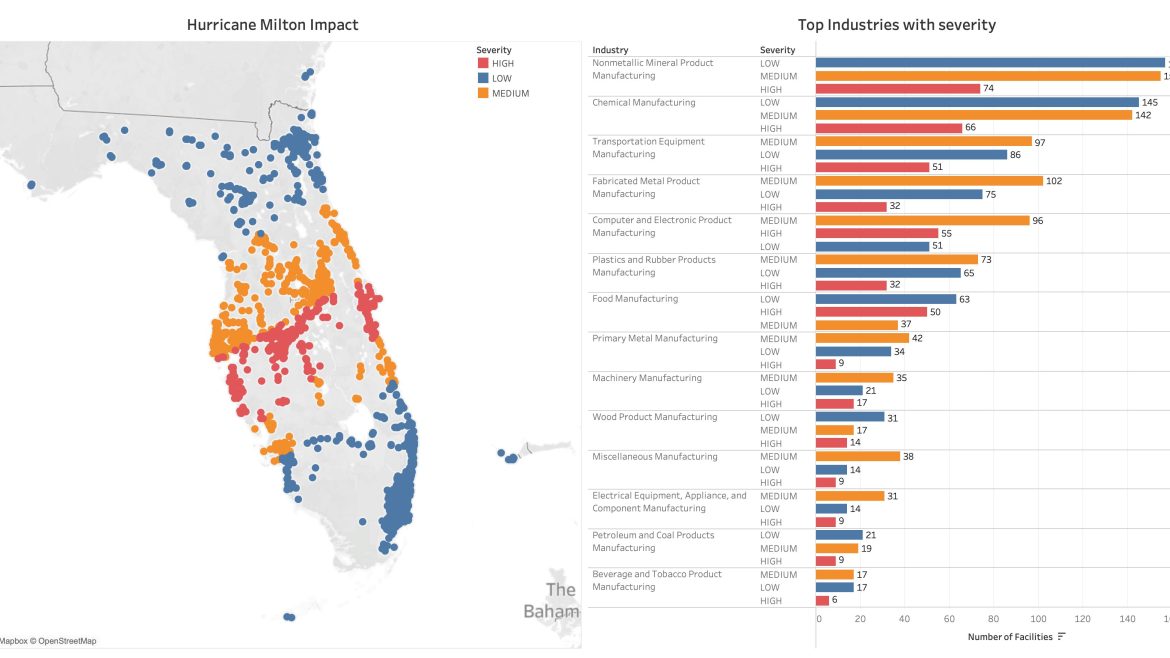
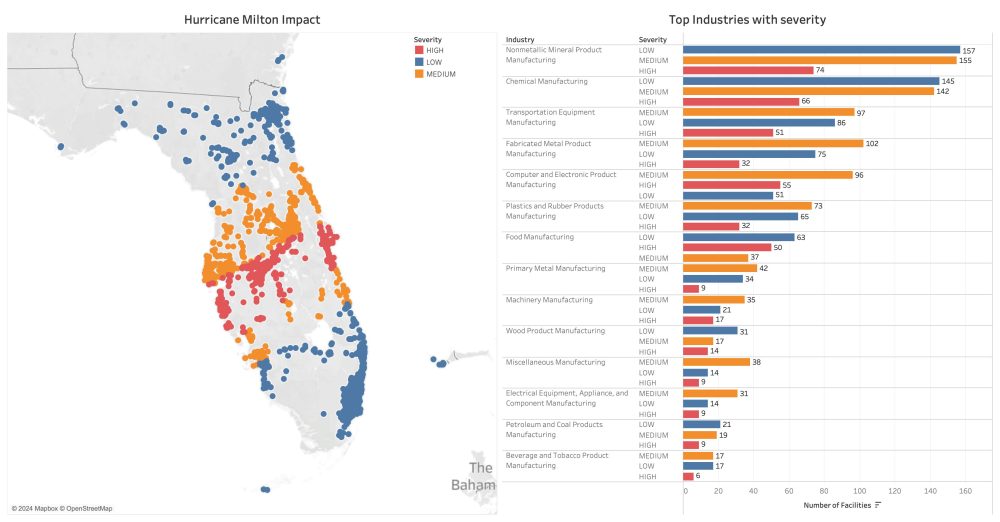
Milton made landfall on Wednesday evening south of Tampa as a category three storm with winds up to 120 mph, significant storm surge, and life-threatening flash flooding. According to the Financial Times, insurance losses could top $60 Billion as the hurricane stays on its projected path.
Insurance implications after an already busy 2024 hurricane season could result in an increase in policies and an impact on insurers’ profitability in some cases.
The Aftermath of Hurricane Helene
According to Artemis, Gallagher Re is projecting that insurance market losses from Helene will rise to the mid-to-high single-digit billion-dollar level, higher than its initial pre-landfall forecast. As recovery efforts continue, loss estimates are expected to fluctuate.
The water damage from the multi-state hurricane has been calamitous, both as it relates to coastal surge and inland flooding. Additionally, the rainfall in Georgia, the Carolinas, Tennessee, and southern Appalachia has resulted in flooding that made history.
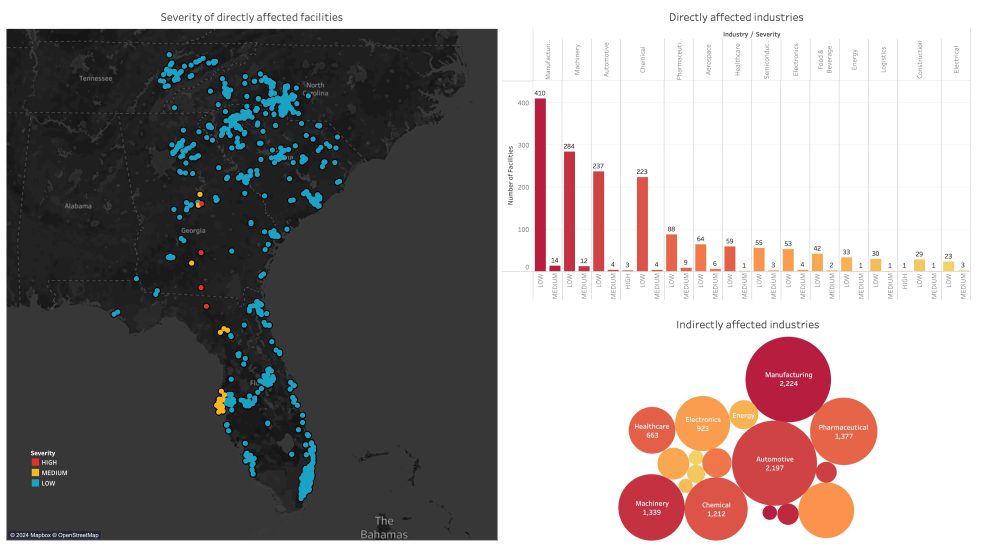
Helene has created significant property and casualty losses and also caused major semiconductor and supply chain disruptions on a global scale with many industries both directly and indirectly impacted by the major storm. Below, Adapt Ready dives into an analysis of this impact on a state-by-state overview.
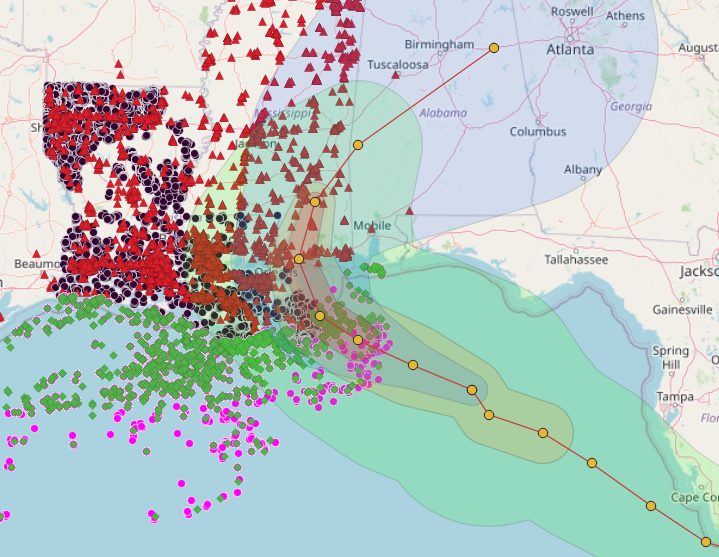
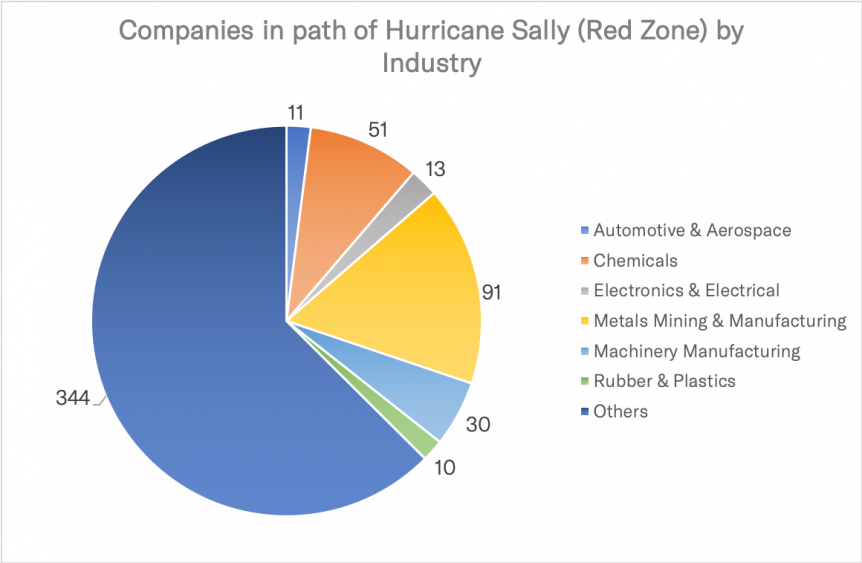
Florida Big Bend
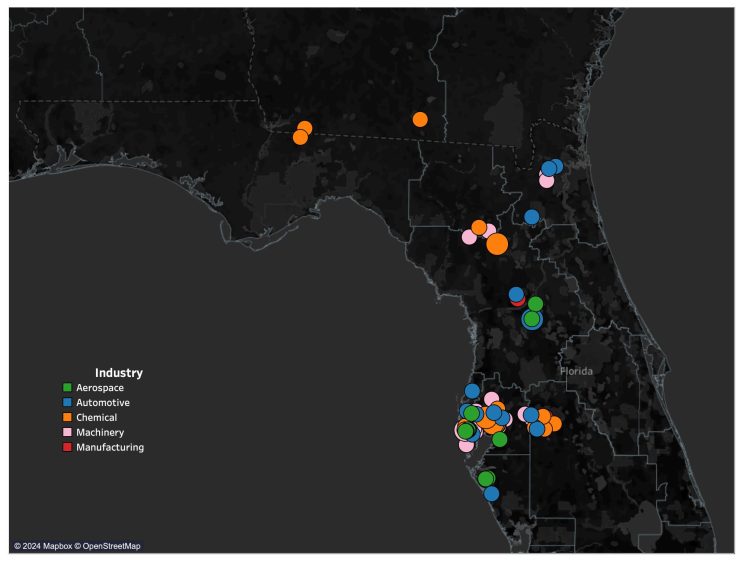
The top five industries impacted in the Florida big bend region include: Machinery and Manufacturing with over 300 facilities between them, Automotive at 60+ facilities, Chemical at 50+ facilities, and Aerospace with nearly 50 facilities.
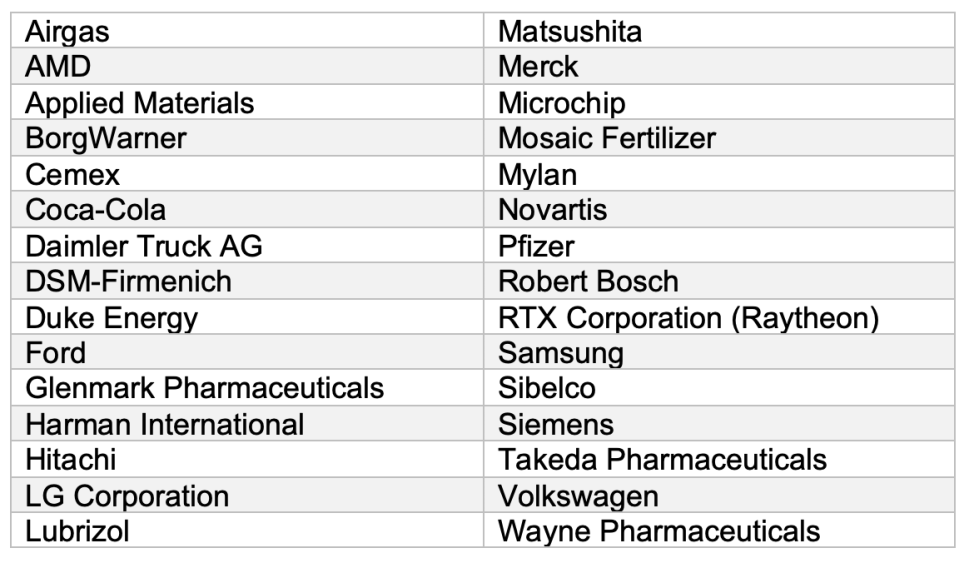
Large organizations with potential direct disruption at their facilities as a result of Hurricane Helene include Robert Bosch, Samsung, and Hitachi.
Indirect exposure also has significant supply chain and business interruption implications. In the big bend region of Florida, with the top impacted industries being Manufacturing, Automotive, Pharmaceutical, Machinery, and Semiconductor.
Georgia
In the state of Georgia, the most exposed industries include Chemicals, Manufacturing, Machinery, Automotive, and Pharmaceuticals. Potentially impacted facilities include those belonging to Milliken & Co, Wilo, DSM-Firmenich, and Wayne Pharmaceuticals.
As an extension of the supply chain impacts, Helene’s potential indirect impacts reverberated on industries including Semiconductor, Electronics, Manufacturing, Automotive, and Machinery.
North Carolina
In the state of North Carolina, as with Georgia, Hurricane Helene impacted the Manufacturing, Machinery, Automotive, Chemical, and Pharmaceutical industries, including potential downtime at facilities belonging to BorgWarner, Lubrizol, and Glenmark Pharmaceutials.
The hurricane was a cause of concern to the world’s semiconductor and solar panel manufacturing industries, given that the state produces high-purity quartz essential to those industries. After a two-week shutdown, Sibelco restarted its mining and processing operations at Spruce Pine.
Across all of the impacted states, Manufacturing, Machinery, and Automotive are the three most consistently affected industries dealing with major disruptions from Helene.
Adapt Ready’s Differentiating Value
During this time of catastrophic loss and uncertainty, it’s an important reminder of how interconnected the world is.
Adapt Ready is closely monitoring the developing losses as a result of Helene and is actively monitoring the potential impacts of Hurricane Milton. We are keeping an eye on global supply links while helping our customers map the possible fall-out, ensuring they have a clear picture of the risk facing their operations, and identifying viable solutions to mitigate their supply chain weaknesses.
We know that many of the losses experienced in the insurance industry are a result of supply chain and business interruption. That is why we have developed a bespoke, integrated solution that closes that gap for Underwriters, Risk Managers, and Brokers globally.
Our end-to-end platform effectively maps locations that may experience exposure and overlays different hurricane considerations along with estimated storm surge and other natural catastrophes. These insights are critical for proactively managing risk and can help manage total outcomes by reducing loss costs.
Adapt Ready’s Risk Intelligence & Analytics Platform, Aria, is powered by Artificial Intelligence and Big Data analytics, combining critical components that allow us to map the global supply chain and energy infrastructure, seamlessly offering a suite of products on top of Aria.
These products:
- Analyze upstream, midstream and downstream dependencies to optimize portfolio risk, making the entire process highly cost-effective.
- Address Business Interruption and Contingent Business Interruption across the Supply Chain. Our risk intelligence helps plan for the appropriate insurance coverage, provides guidance on risk management practices, and offers proactive risk monitoring – all of which are critical in an evolving risk management landscape.
- Apply the latest advances in climate science to uncover climate risks in supply chains and portfolios.
Contact
To better understand how the Adapt Ready platform can be used to quantify risk and plug the data gaps in global risk exposure, and catastrophic management, please contact us to schedule a demo.