insurance

Facing The Eye of the Storm: The Aftermath of Hurricanes Helene and Milton

Facing The Eye of the Storm: The Aftermath of Hurricanes Helene and Milton 2560 1336 adapt ready

A Look at Hurricane Milton

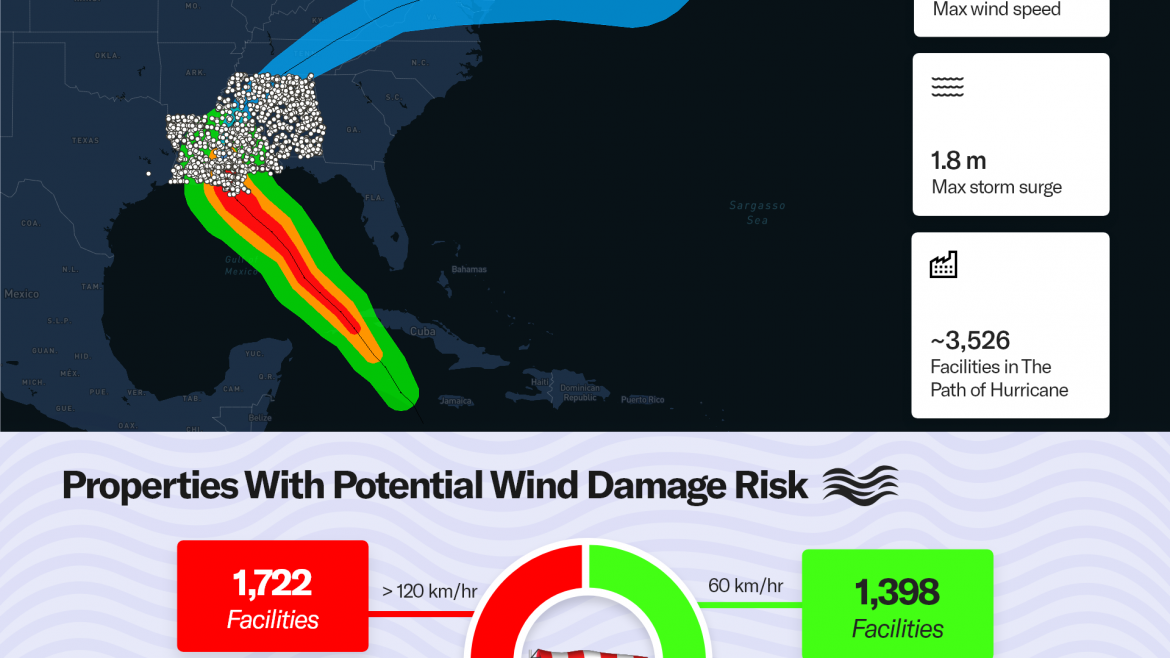
Milton made landfall on Wednesday evening south of Tampa as a category three storm with winds up to 120 mph, significant storm surge, and life-threatening flash flooding. According to the Financial Times, insurance losses could top $60 Billion as the hurricane stays on its projected path.
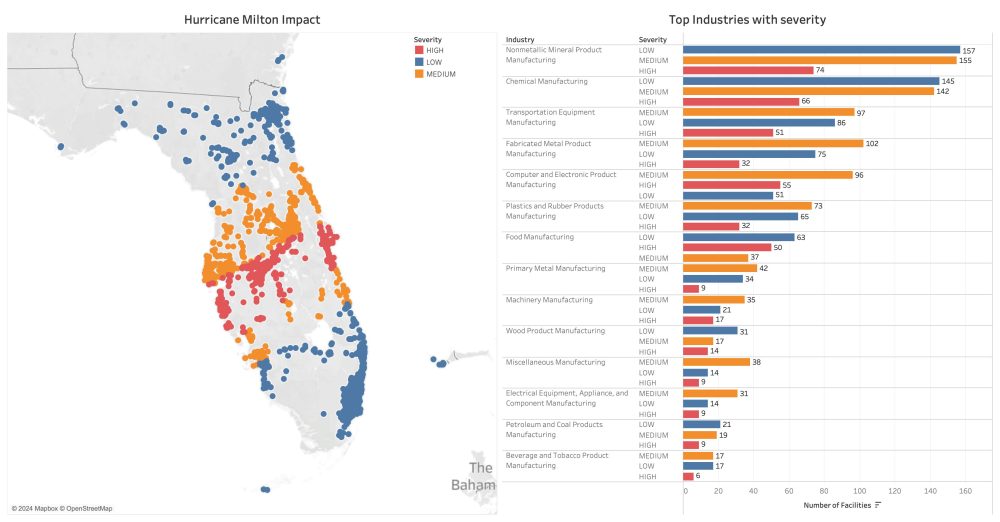
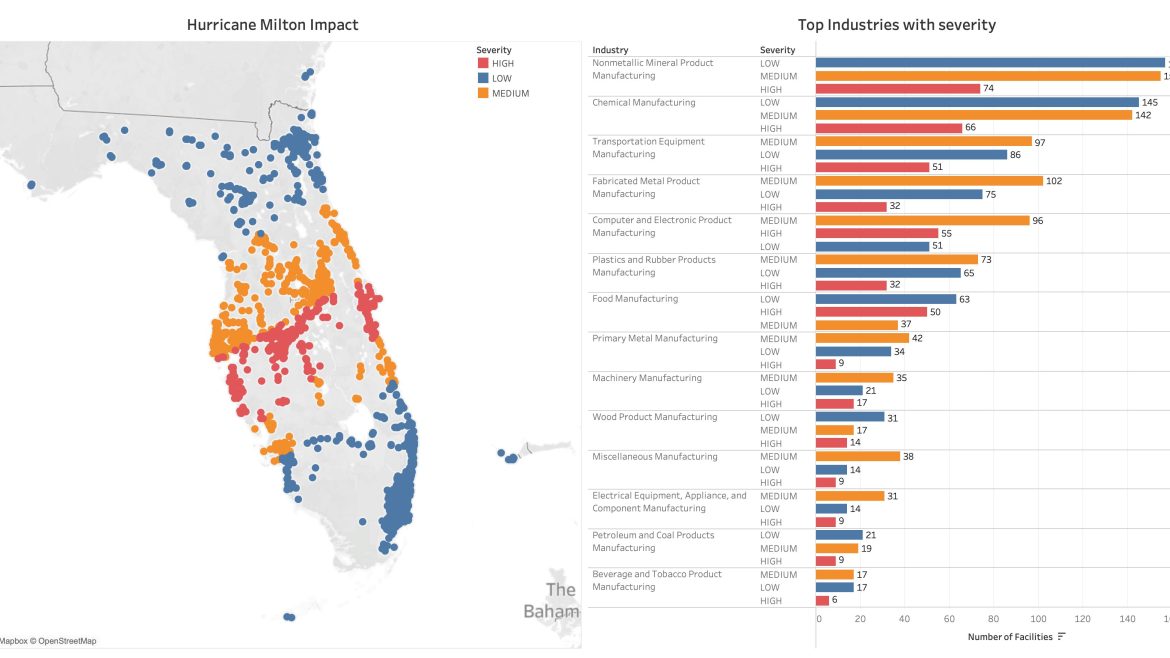
Potential industrial impacts from Hurricane Milton
Fig 1. Industrial impact from Hurricane Milton

Insurance implications after an already busy 2024 hurricane season could result in an increase in policies and an impact on insurers’ profitability in some cases.

The Aftermath of Hurricane Helene

According to Artemis, Gallagher Re is projecting that insurance market losses from Helene will rise to the mid-to-high single-digit billion-dollar level, higher than its initial pre-landfall forecast. As recovery efforts continue, loss estimates are expected to fluctuate.
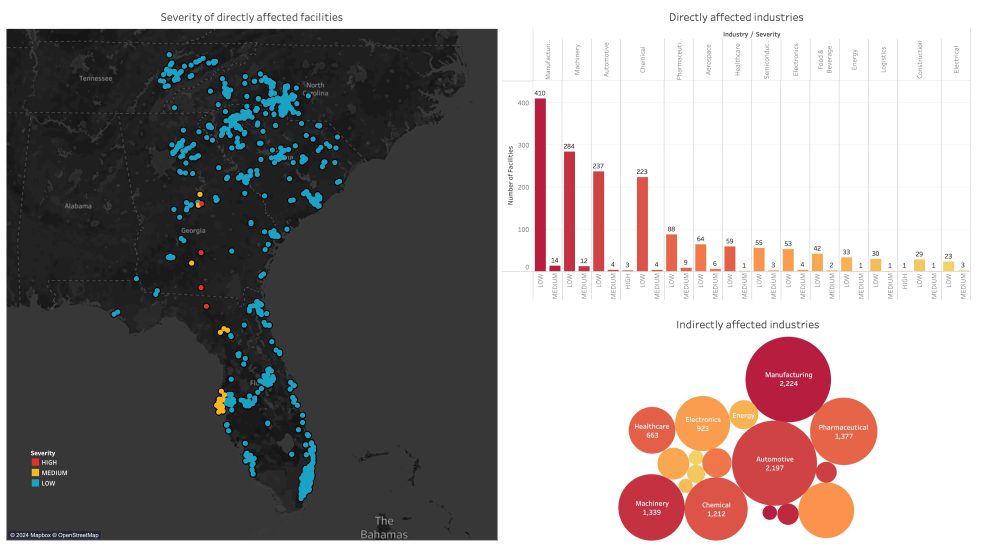
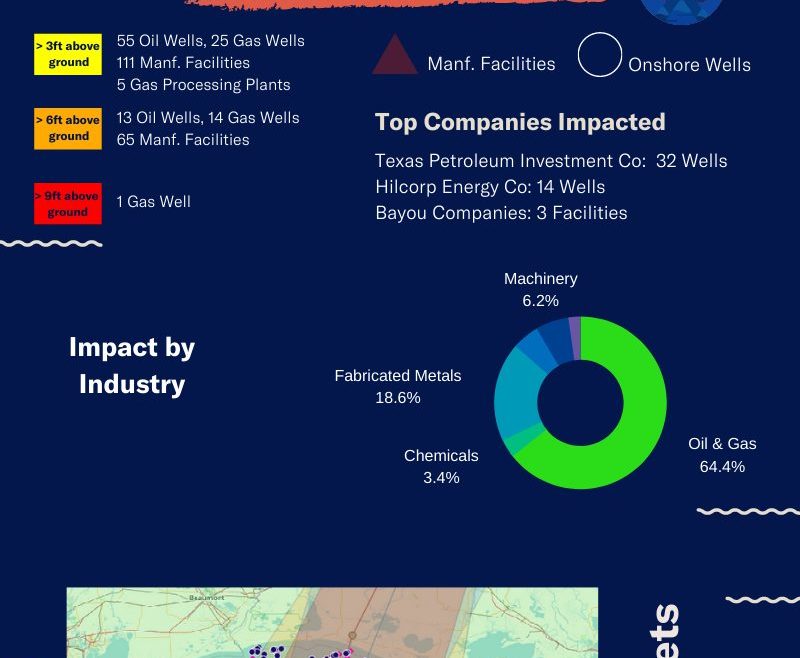
Fig 2. Impact to manufacturing from Hurricane Helene

The water damage from the multi-state hurricane has been calamitous, both as it relates to coastal surge and inland flooding. Additionally, the rainfall in Georgia, the Carolinas, Tennessee, and southern Appalachia has resulted in flooding that made history.

Helene has created significant property and casualty losses and also caused major semiconductor and supply chain disruptions on a global scale with many industries both directly and indirectly impacted by the major storm. Below, Adapt Ready dives into an analysis of this impact on a state-by-state overview.

Florida Big Bend
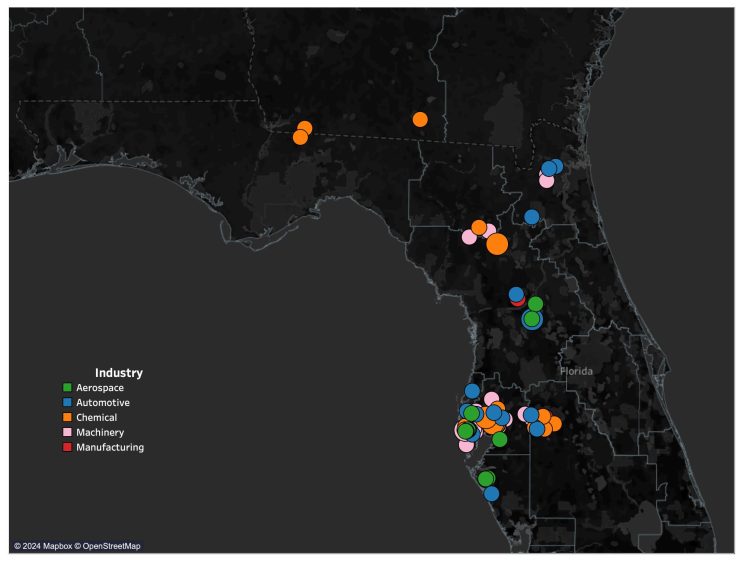
Fig 3. Impacts in the Big Bend region
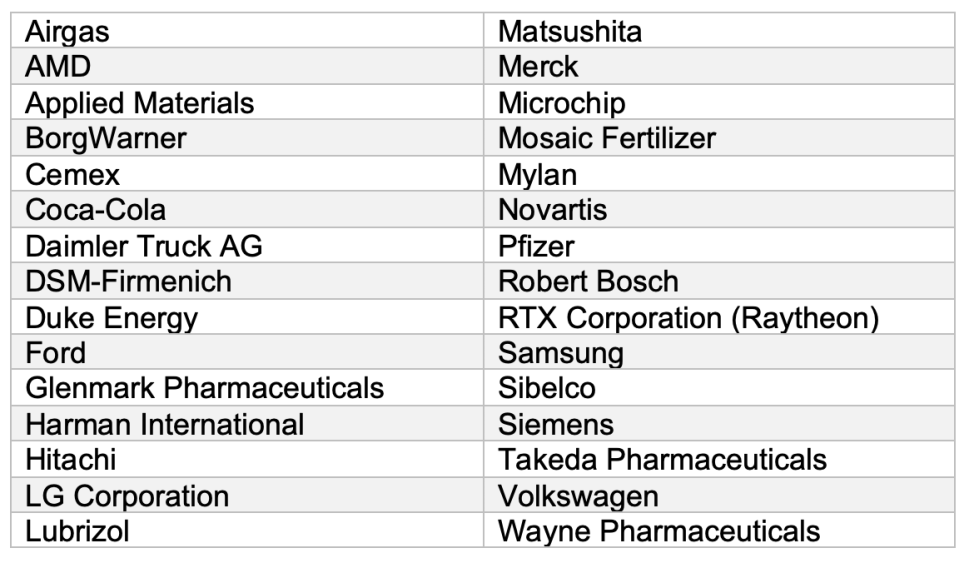
Fig 4. Companies directly or indirectly in Helene’s impact zone

The top five industries impacted in the Florida big bend region include: Machinery and Manufacturing with over 300 facilities between them, Automotive at 60+ facilities, Chemical at 50+ facilities, and Aerospace with nearly 50 facilities.

Large organizations with potential direct disruption at their facilities as a result of Hurricane Helene include Robert Bosch, Samsung, and Hitachi.

Indirect exposure also has significant supply chain and business interruption implications. In the big bend region of Florida, with the top impacted industries being Manufacturing, Automotive, Pharmaceutical, Machinery, and Semiconductor.

Georgia

In the state of Georgia, the most exposed industries include Chemicals, Manufacturing, Machinery, Automotive, and Pharmaceuticals. Potentially impacted facilities include those belonging to Milliken & Co, Wilo, DSM-Firmenich, and Wayne Pharmaceuticals.

As an extension of the supply chain impacts, Helene’s potential indirect impacts reverberated on industries including Semiconductor, Electronics, Manufacturing, Automotive, and Machinery.

North Carolina

In the state of North Carolina, as with Georgia, Hurricane Helene impacted the Manufacturing, Machinery, Automotive, Chemical, and Pharmaceutical industries, including potential downtime at facilities belonging to BorgWarner, Lubrizol, and Glenmark Pharmaceutials.

The hurricane was a cause of concern to the world’s semiconductor and solar panel manufacturing industries, given that the state produces high-purity quartz essential to those industries. After a two-week shutdown, Sibelco restarted its mining and processing operations at Spruce Pine.

Across all of the impacted states, Manufacturing, Machinery, and Automotive are the three most consistently affected industries dealing with major disruptions from Helene.

Adapt Ready’s Differentiating Value

During this time of catastrophic loss and uncertainty, it’s an important reminder of how interconnected the world is.

Adapt Ready is closely monitoring the developing losses as a result of Helene and is actively monitoring the potential impacts of Hurricane Milton. We are keeping an eye on global supply links while helping our customers map the possible fall-out, ensuring they have a clear picture of the risk facing their operations, and identifying viable solutions to mitigate their supply chain weaknesses.

We know that many of the losses experienced in the insurance industry are a result of supply chain and business interruption. That is why we have developed a bespoke, integrated solution that closes that gap for Underwriters, Risk Managers, and Brokers globally.

Our end-to-end platform effectively maps locations that may experience exposure and overlays different hurricane considerations along with estimated storm surge and other natural catastrophes. These insights are critical for proactively managing risk and can help manage total outcomes by reducing loss costs.

Adapt Ready’s Risk Intelligence & Analytics Platform, Aria, is powered by Artificial Intelligence and Big Data analytics, combining critical components that allow us to map the global supply chain and energy infrastructure, seamlessly offering a suite of products on top of Aria.

These products:

  • Analyze upstream, midstream and downstream dependencies to optimize portfolio risk, making the entire process highly cost-effective.
  • Address Business Interruption and Contingent Business Interruption across the Supply Chain. Our risk intelligence helps plan for the appropriate insurance coverage, provides guidance on risk management practices, and offers proactive risk monitoring – all of which are critical in an evolving risk management landscape.
  • Apply the latest advances in climate science to uncover climate risks in supply chains and portfolios.

Contact 

To better understand how the Adapt Ready platform can be used to quantify risk and plug the data gaps in global risk exposure, and catastrophic management, please contact us to schedule a demo.
event and impacts summary 2023

Looking ahead: what do risk managers need to look out for in 2024?

Looking ahead: what do risk managers need to look out for in 2024? 1433 1075 Shruthi Rao

There’s no such thing as “normal” when it comes to risk.  The speed at which new risks emerge, and existing ones evolve means that risk managers are working in a constant state of flux. How can they identify and manage novel risks when they move so quickly?

2023 showed us that now, more than ever, risk managers must keep their eyes on other countries. It’s no longer enough to monitor and mitigate localised events; natural and man-made disasters thousands of miles away can have a profound effect on their business, particularly if they’re in the supply chain or energy infrastructure sectors.

Looking back at last year, we saw several notable global themes that sent ripples around the world:

  • High rates of inflation disrupting global economies
  • Geopolitical turmoil and humanitarian crises, particularly in the Ukraine and Middle East
  • Record-breaking global temperatures exacerbating nat-cat events

What lies ahead?

Based on our analysis of the last twelve months, we believe the following events could be on the cards for 2024:

  • The ongoing conflict between Israel and Hamas is destabilizing the region and disrupting the networks of supply chains in oil, technology, and agriculture. Further instability or escalation in the Middle East or Asia could increase the vulnerability of international supply chains substantially.
  • For example, connected risk insights from our platform also reveals a potential increase in global fertilizer prices given the increased cost of shipping and impacting subsidies in countries like India (which imported 3.41 million metric tons of fertilizers including urea between April-November 2023)
  • It is predicted that the utilities and the power sector will continue to focus on grid modernization and decarbonization.
  • Extreme heat and drought conditions, which are predicted to continue to disrupt power sector operations, will probably necessitate the industry’s need for new tools and technologies, such as AI and advanced analytics.
    • With Tropical Storm Risk’s extended range forecast for the 2024 North Atlantic hurricane season predicting activity 30% above the 1991-2020 30-year norm, it becomes all the more important for risk managers to start preparing sooner, while underwriters can run detailed models on their current portfolio to highlight potential hotspots – our platform is designed to answer these types of “what-if” scenarios at the click of a button
  • After a slowdown in 2023, global power demand is predicted to bounce back in 2024. As the forecast for the economy improves, the International Energy Agency (IEA) projects that the worldwide growth rate for energy consumption will increase to 3.3% in 2024.
  • “On-shoring” of pharmaceutical manufacturing in the US is expected to increase, with support from federal funding but whether they will be able to compete on the delivery capacity and schedule is something only time will tell

The ability of risk managers to respond to these challenges hinges on the quality of data they can leverage to better understand how global events will impact their businesses.

Adapt Ready uses trillions of data points gathered from open and closed sources all over the globe to create a sophisticated modelling system for risk managers and insurers.  The deep insights generated by our risk intelligence platform                 allow customers to optimize their risk selection and pricing, solving costly accumulation and reinsurance scenarios in their portfolios.

Though we can’t predict what’s to come, using a huge breadth and depth of data can help us understand the evolution of risk and the wide-ranging impact of events on businesses and individuals all around the world.

We’d love to show you how powerful our risk intelligence platform is. Get in touch to arrange a demo based on your specific business and see how with the right data, you can get ahead of what’s to come.

Visit https://adaptready.com or contact info@adaptready.com

Hurricane Ian: Impact Report

Hurricane Ian: Impact Report 150 150 adapt ready

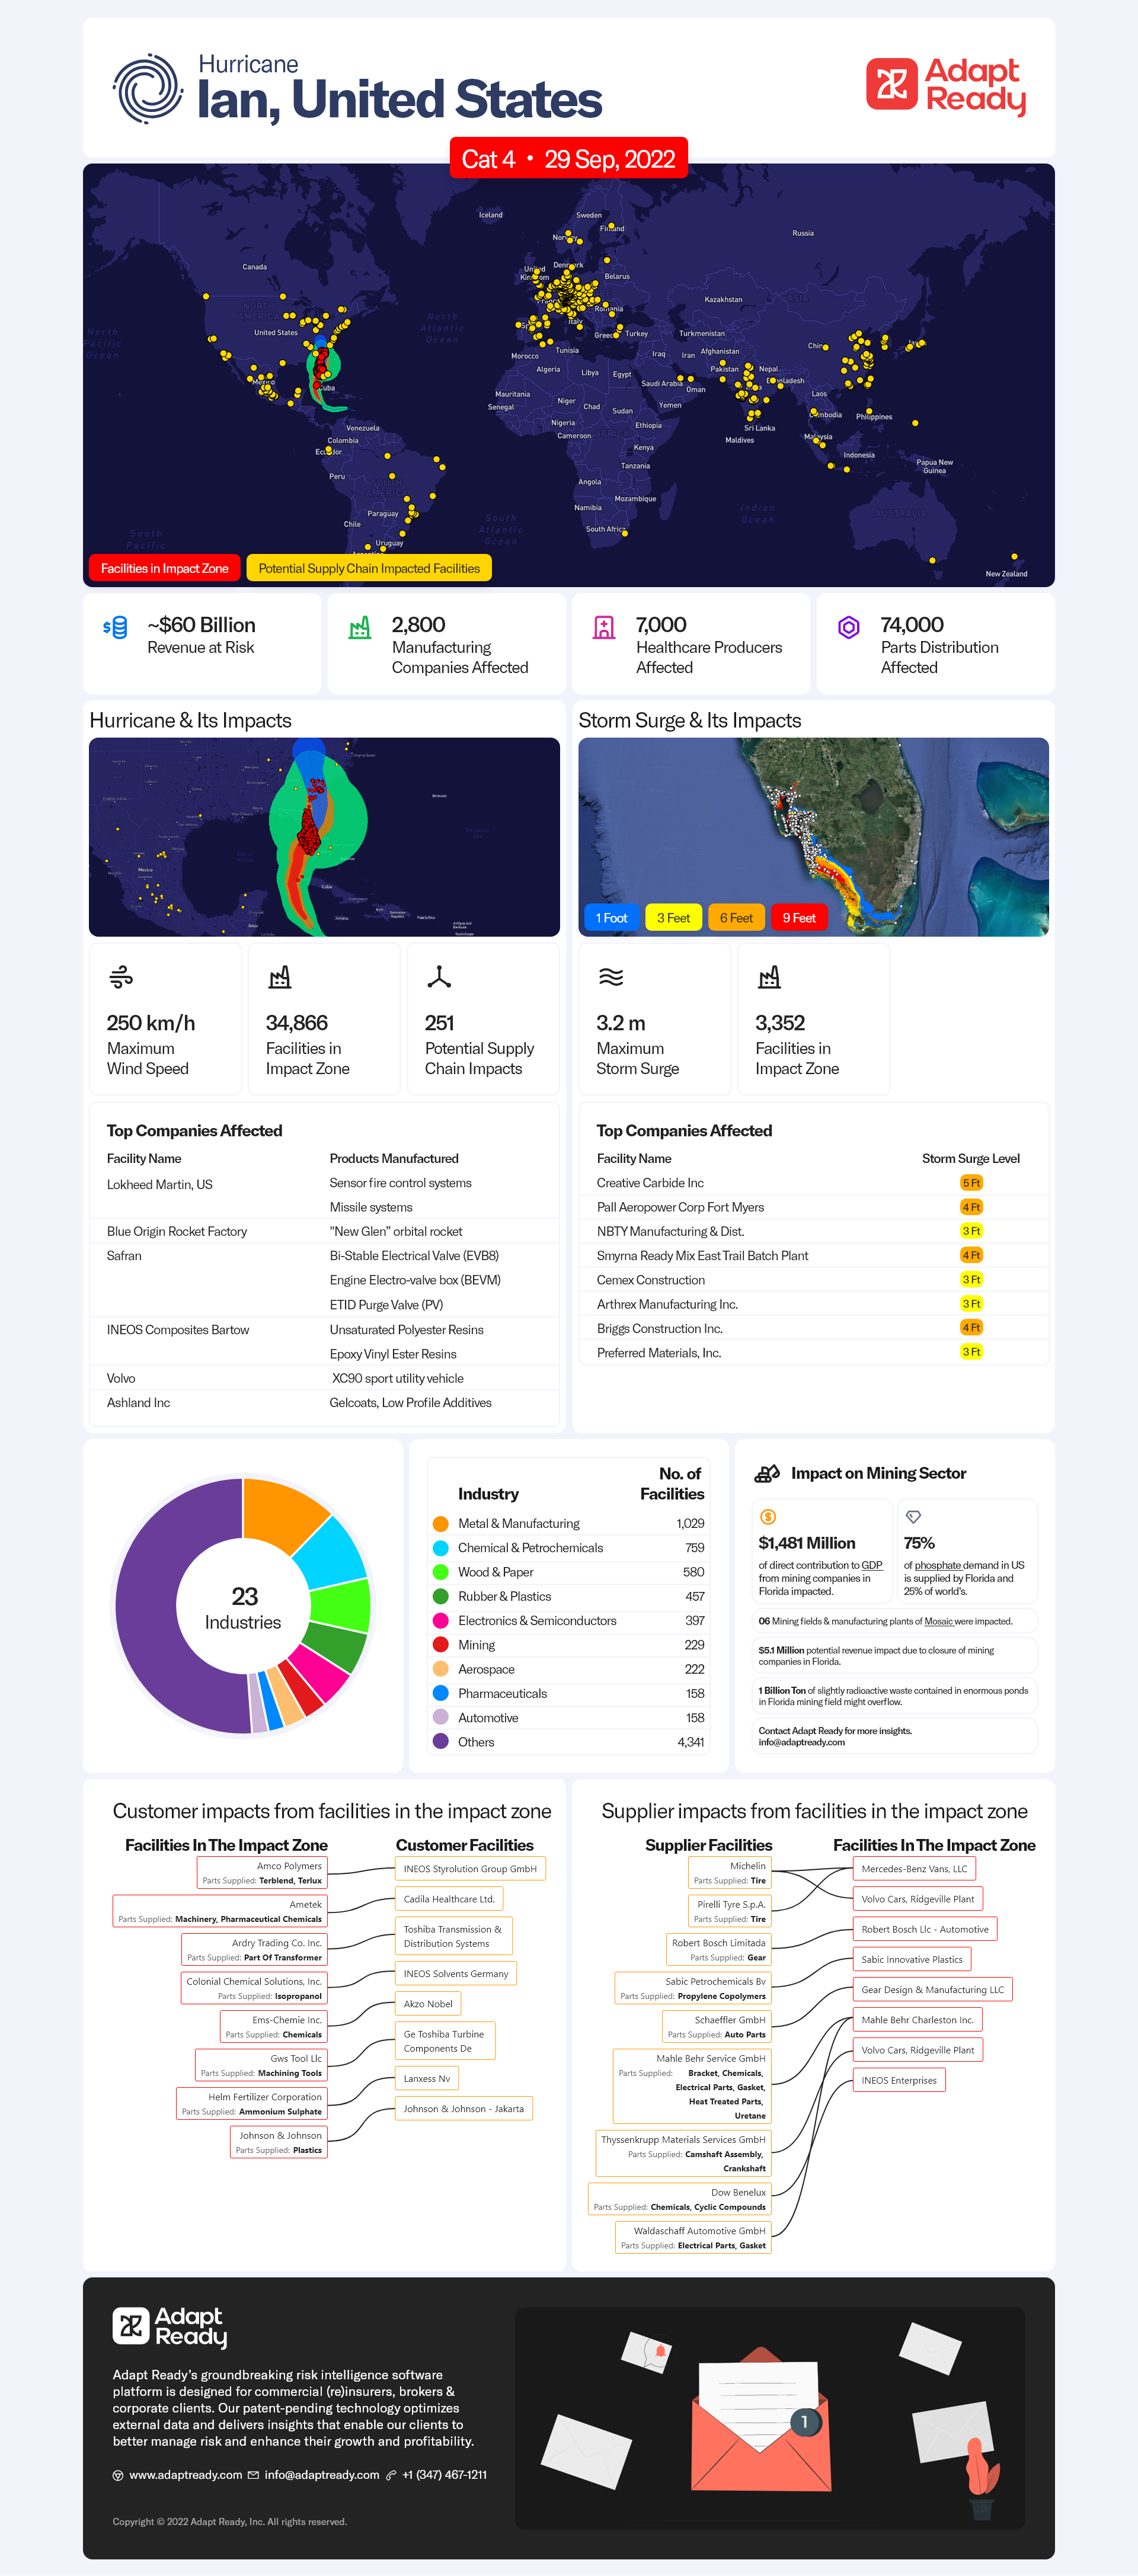
As Hurricane Ian finishes raking over central Florida after making landfall near Fort Myers, FL, a hairsbreadth away from Category 5 status, we can start to assess the impact this devastating storm will have on global supply chains.

It is consistently surprising, even for us at Adapt Ready, how interconnected companies are and when a disaster strikes a densely packed zone of development like the central Florida coast, the effects are felt as far away as the Middle East, China, Australia, South Africa and Europe.

Hurricane Ian Report

Our platform has tracked nearly 35,000 facilities in the current estimated impact zone with the most affected companies being concentrated in aerospace (Lockheed Martin, Blue Origin Rocket Factory) and manufacturing (Safran, Volvo) and, surprisingly, mining.

From this second map, we can see that phosphate mining is quite intensive in the region right in the path Hurricane Ian took after landfall (the colored areas in the middle present the largest concentration of phosphate mines in America and second only to Morocco in the world).

Florida represents about 25% of the global supply of phosphate and though these mines are unlikely to experience substantial and prolonged disruption, there is a real concern with the possible pollution that emanates from these mines during a storm (see article).

Normally it’s likely there are large stockpiles of primary commodities like phosphate and short-term price disruptions are mitigated by hedging instruments for commodity buyers.  However, this remains another example of how information about supply chain concentrations and bottlenecks can improve risk management in the face of natural disasters.

It is also important to recognize that supply chain disruptions don’t only impact the primary inputs. Note the bottom of our infographic which lists several suppliers impacted by their customers’ disruptions: Michelin Tires impacted by Volvo and Mercedes manufacturing plants and in the forthcoming South Carolina landfall, Dow Chemical by disruption to Mahle Behr in Charleston which specializes in auto cooling and air conditioning components.

In addition to all the above, Tampa has the largest port in Florida and disruptions to its operations could exacerbate direct damage to the sectors noted above and cause further congestion to other transportation facilities as goods are redirected.

Even though the phosphate industry may not suffer tremendously from damage by hurricanes, the fact of extreme specialization and concentration in certain supply chains could have long lasting impacts in other sectors.

Hurricane Ida: Impact Report

Hurricane Ida: Impact Report 1919 1587 adapt ready

Hurricane Zeta: Impact Report

Hurricane Zeta: Impact Report 1043 710 adapt ready

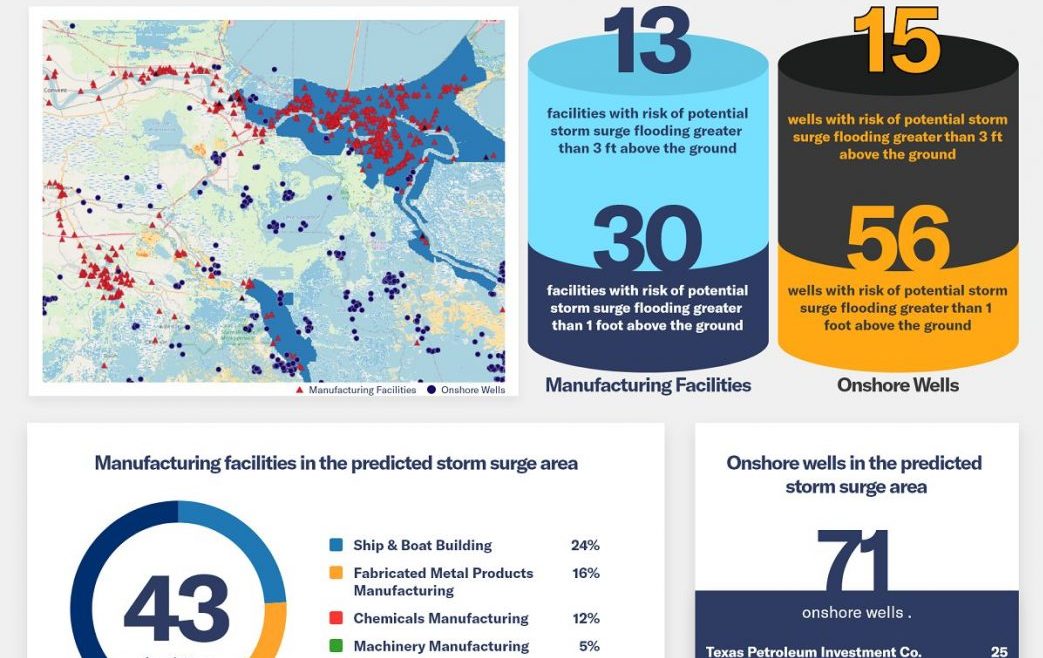
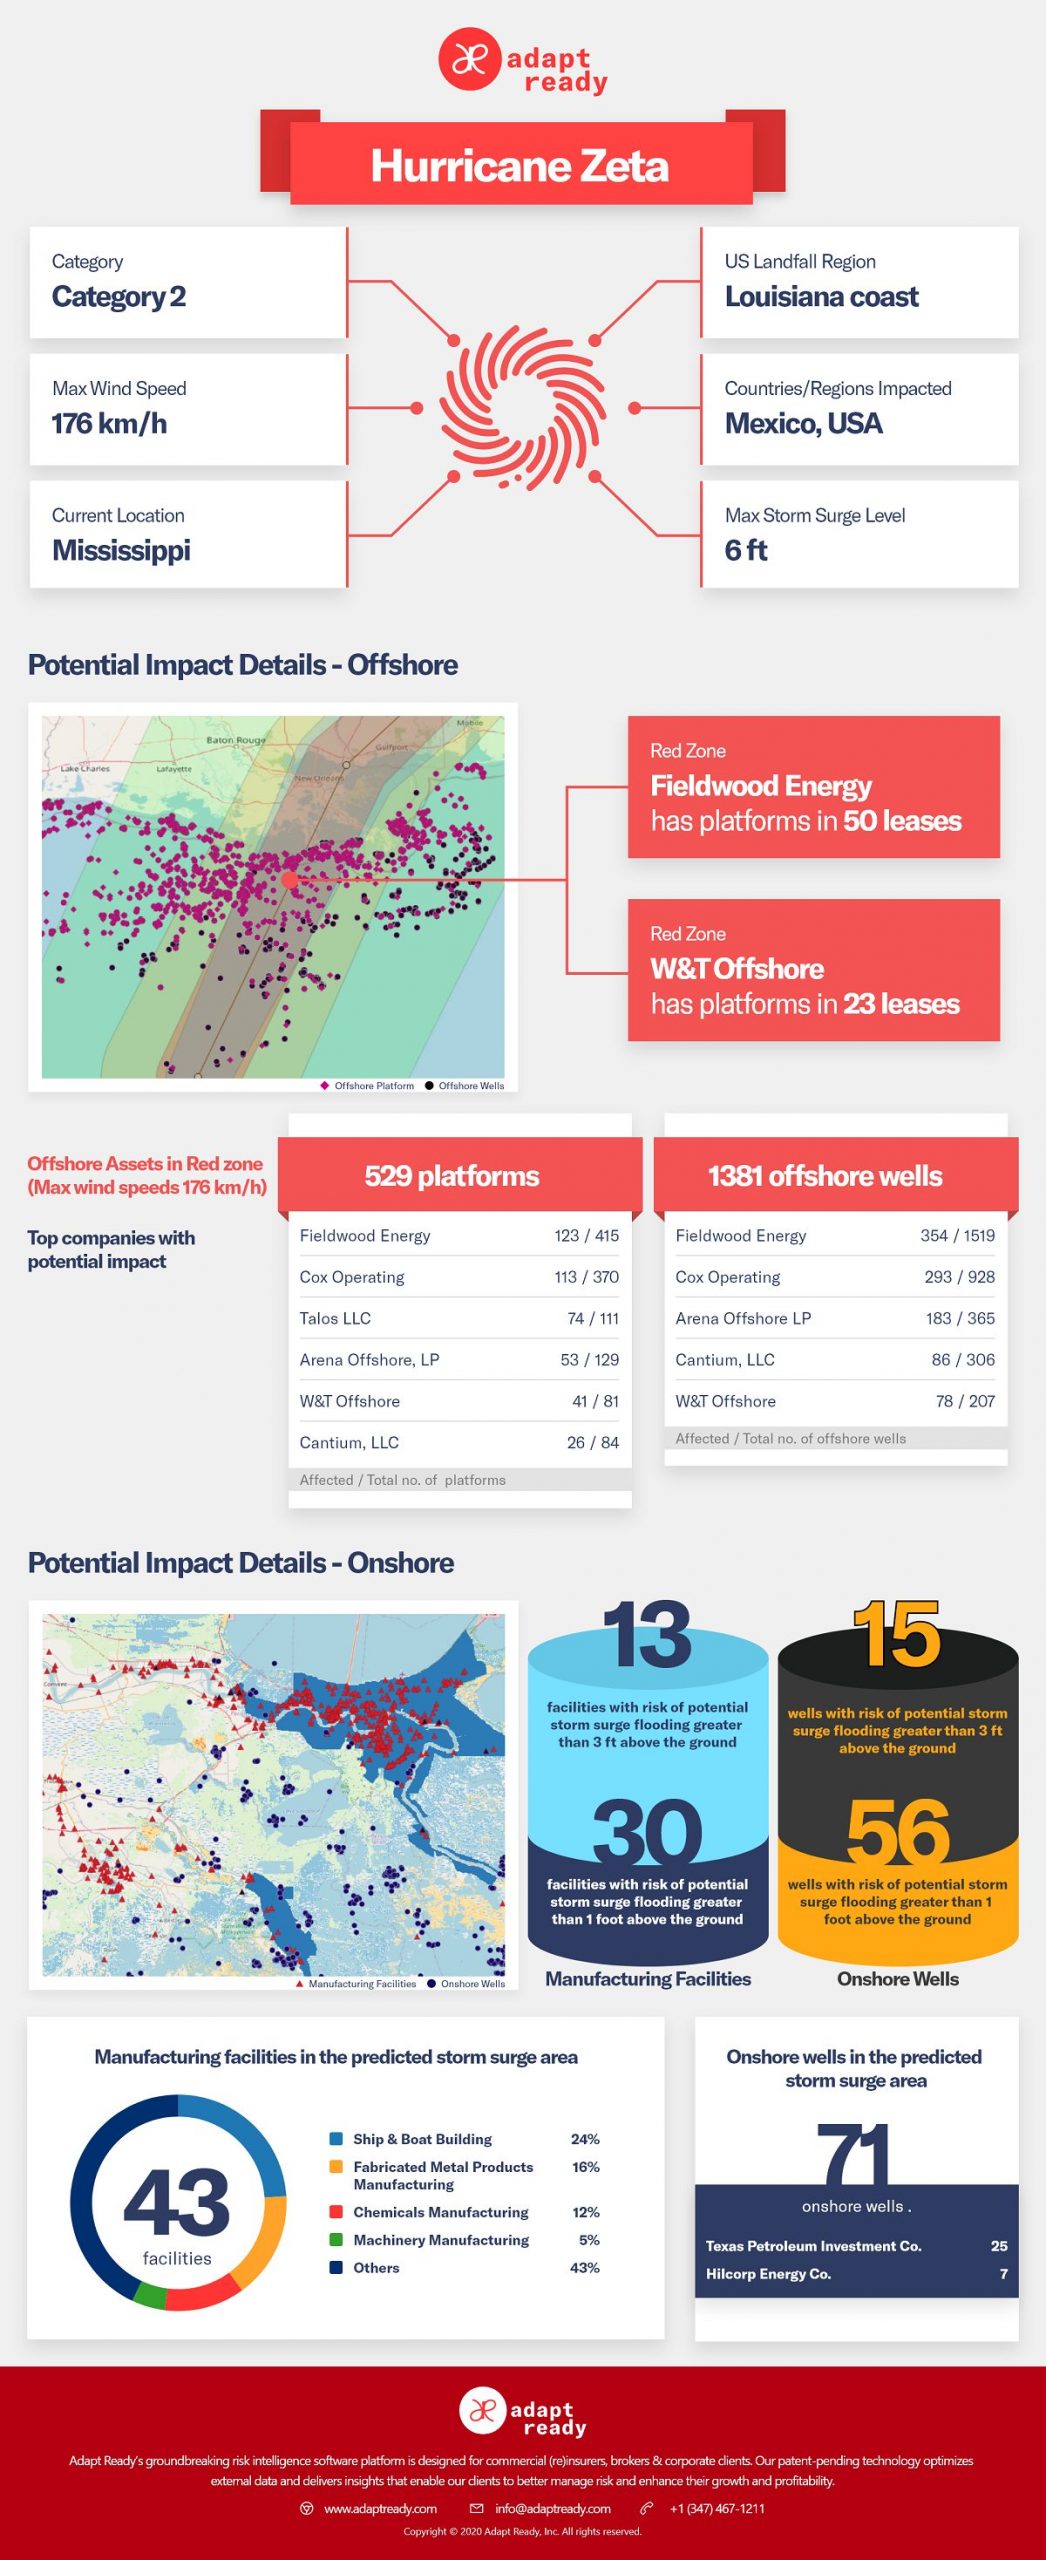
Hurricane Zeta, a Category 2 storm, made landfall near Cocodrie, Louisiana on Wednesday October 29th causing massive power outages across the Gulf Coast leaving 556,000 customers in Louisiana without power. As of this update, the storm is currently in Mississippi with max windspeeds of 176 km/h and storm surge levels up to 6ft, posing a major threat to the oil & gas assets, both offshore and onshore.

Zeta is a record 9th storm to hit the Gulf Coast this year: a devastating blow to a region already battered by Hurricane Laura (the fifth strongest hurricane on record in the US) in late August, Hurricane Sally (Category 3) in September and Hurricane Delta (Category 4) this month, causing extensive property damage and loss of life.

This continues the pattern of an increasing number of storms in the Atlantic season. In 2018 there were 15 named storms of which 8 became hurricanes and 2 were major events (Cat 3 and above). In 2019 there were 18 named storms, of which 6 became hurricanes and 3 were major events. This season we now have 27 named storms, a staggering 12 hurricanes and 4 major events making it the heaviest storm season for some time (the last time we had more than 12 hurricanes in the Atlantic season was back in 2005).

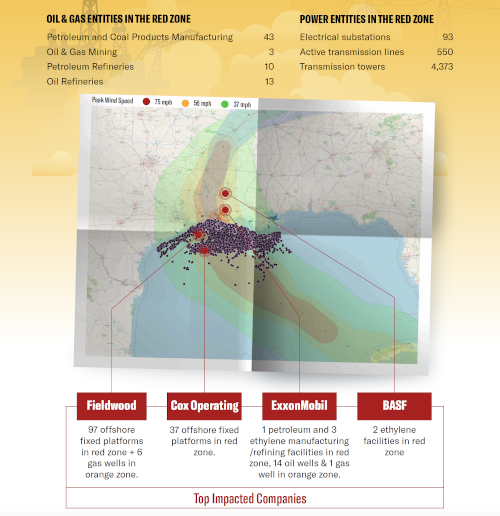
As the heart of energy production in the US it is no surprise to see the main companies and industries expected to be affected by the red zone (area with the highest predicted windspeeds) of Hurricane Zeta:

Top 5 companies operating and leasing platforms:

1. Fieldwood Energy with 123 active platforms
2. Cox Operating LLC with 113 active platforms
3. Talos LLC with 74 active platforms
4. Arena Offshore with 53 active platforms
5. W&T Offshore with 41 active platforms

Top 5 companies with offshore wells in the red zone:

1. Fieldwood Energy – 354
2. Cox Operating – 293
3. Arena Offshore LP – 183
4. GOM Shelf – 86
5. Cantium LLC – 78

With the energy sector again taking the biggest hit due to the location of predicted landfall, you might have seen in the last two reports, that both Cox and Fieldwood Energy are expected to be the most effected. This is because of the sheer number of wells and platforms they have in this region. As the two largest platform and well operators in the affected zones they will always feature heavily in such reports as Fieldwood Energy operates 23% and Cox Operating LLC 21% of all active platforms in the region.

Top 5 companies with Onshore Wells

  1. Hilcorp Energy Company – 202
  2. FDL Operating, LLC – 139
  3. Texas Petroleum Investment Co. – 122
  4. Denbury Onshore, LLC – 88
  5. S2 Energy Operating LLC – 85

Due to the nature of risk assessment and underwriting being driven by who the lease holders of properties are, it is important to address the current leaseholders of potentially affected assets.

CompanyLeases
Fieldwood49
W&T23
Talos22
Arena Energy21
EPL Oil & Gas12
Leaseholders predicted to be most at risk of damage

Manufacturing facilities in Ship Building, Fabricated Metal Products, Chemicals & Petrochemicals and Mining Support are in the regions of potential storm surge flooding of up to 4ft above the ground. These businesses could well be under threat from some physical damage, but we do not think there will be significant damage or losses to these and their connected industries.

If you would like more information as to your specific portfolio requirements in the affected area or just want to be kept up to date with real time hurricane impacts this season, then please contact riskmonitor@adaptready.com.

About Adapt Ready:

Adapt Ready’s ground-breaking risk intelligence platform delivers new data insights and fills in key gaps with external data, enabling our customers to better manage operational and financial risks, and to enhance their growth and profitability. With our platform, organizations can gain insights from external data tailored to specific situations before, during and after a crisis:

  • Before: Plan for risks by uncovering as many hidden risks as possible
  • During: Mitigate the impact – as events unfold, new data emerges and can inform decisions to reduce the event’s impact
  • After: Adapt to new conditions and refine future business direction

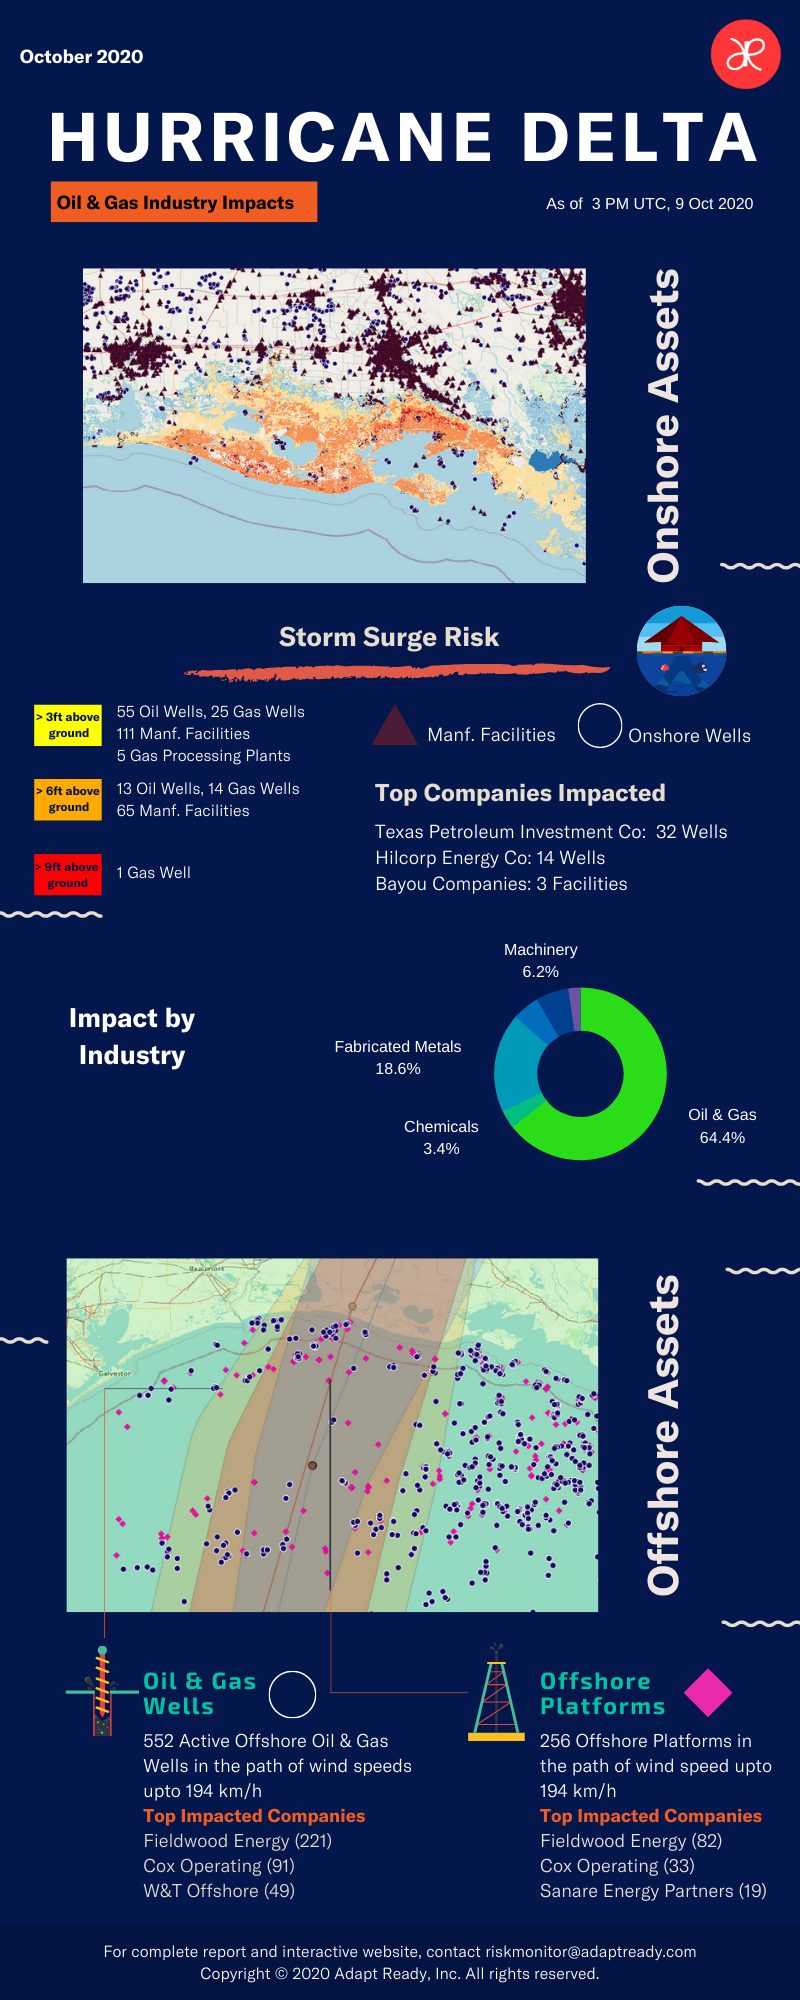
Hurricane Delta: Impact Report

Hurricane Delta: Impact Report 800 440 adapt ready

Hurricane Sally: Impact Report

Hurricane Sally: Impact Report 1785 1169 adapt ready

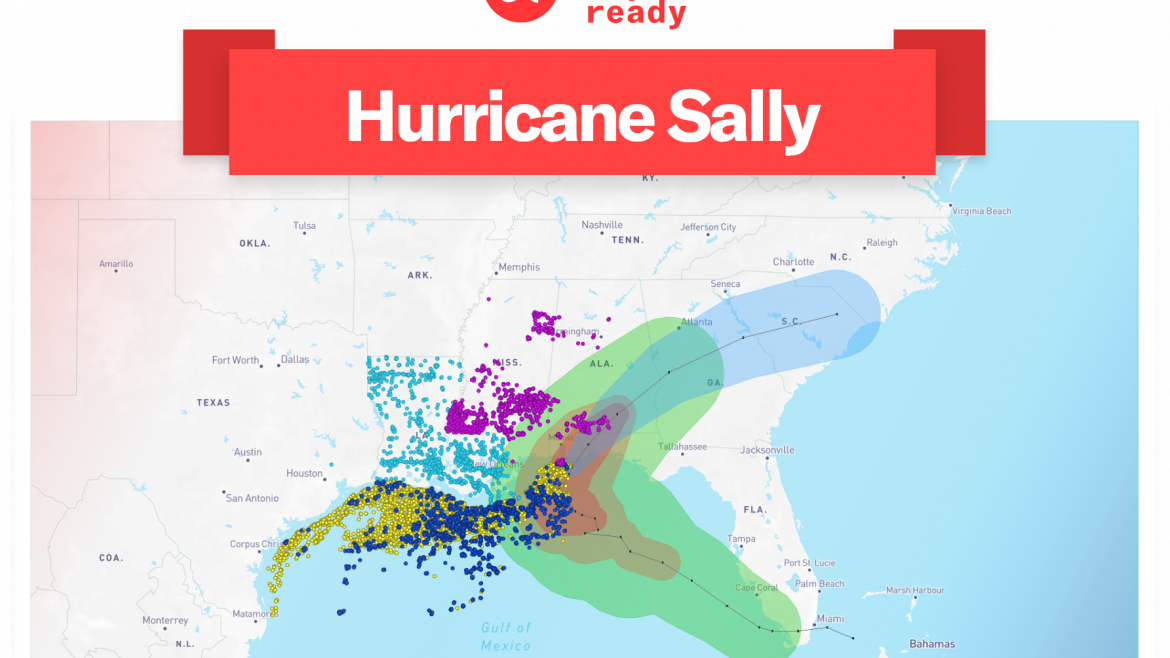
The new interactive infographic above allows Insurers and reinsurers to see their exposures as hurricane Sally’s predicted path evolved. Then, the actual path as Sally made landfall on the 16th September.

This infographic shows how as Louisiana was being predicted to face the brunt of the storm having the relevant data at the right time to assess the industries and companies allows insurers and reinsurers to prepare for reserving on their portfolios and risks where necessary.

By simply moving the slider in the infographic, you can see how each projected path could have impacted Louisiana’s wells and companies in real time up until hurricane Sally made landfall when the real impact became known (path 4)

This infographic is focused on the Louisiana area just to show the potential of this style of risk analysis; however, we are also covering the impact upon Alabama’s onshore wells and companies in Florida now that landfall has been made and initial data is showing the following:

Alabama

  • BASF
  • Coastal Oil & Gas Corporation
  • ExxonMobil Production Company
  • Goodrich Aerostructures
  • Guyoungtech USA, Inc. (a tier 1 supplier to Hyundai, Kia and other automotive companies)

Florida

  • Air Products & Chemicals
  • Exxon Mobil Chemical Company

If you would like more detailed info on the impact to your specific risk or portfolio, or would just like to know how often these wells or other companies have previously been damaged by major events specific to your risks then please get in touch with our representatives through the links at the bottom of the site.

Tracking Hurricane Sally

Tracking Hurricane Sally 719 557 adapt ready

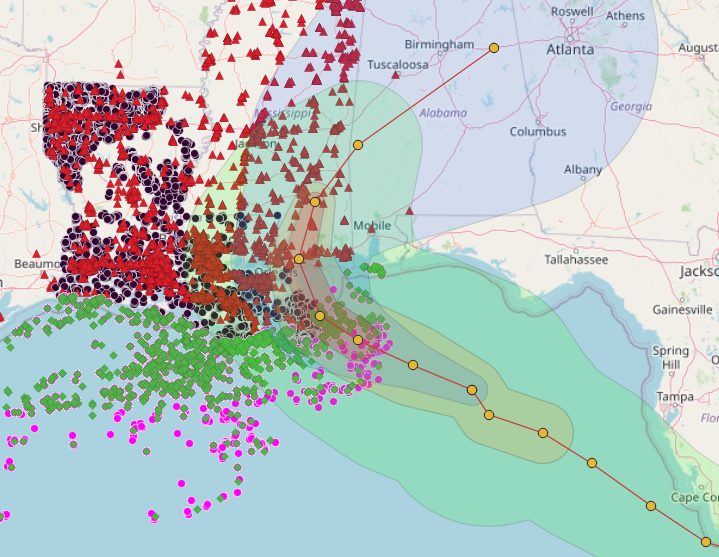
Over 14 hours ago, Tropical Storm Sally turned into Hurricane Sally and changed its course as it made progress towards Louisiana. It is now expected to turn and make its way to the Mississippi-Alabama state line.

The hurricane is likely to further impact the battered oil & gas industry with over 170 offshore platforms and 1,000 offshore wells in the path of the hurricane. Over 500 manufacturing facilities in Mississippi could also bear the brunt of the hurricane and its predicted life-threatening storm surge.

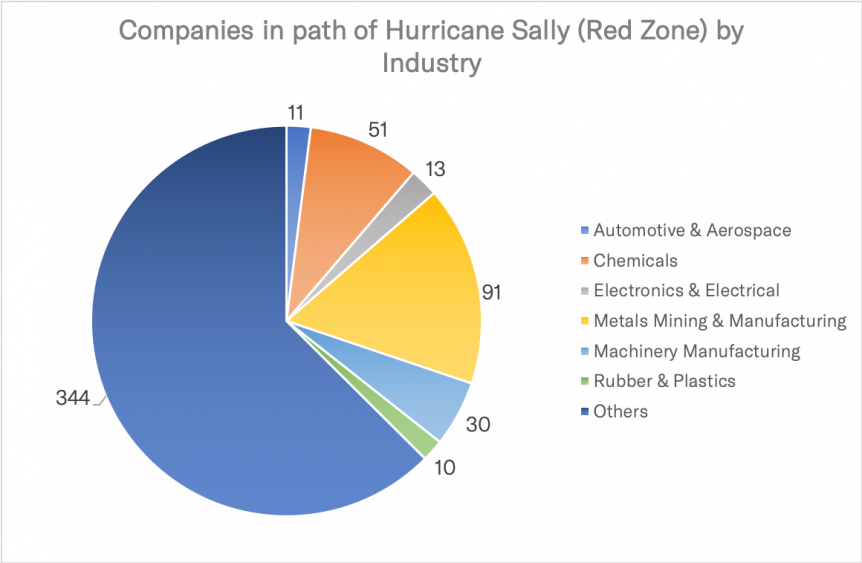
The Chemicals manufacturing industry could see significant impact from Hurricane Sally.

The following is a small subset of the companies that could experience property damage and business interruption.

Offshore Wells
Fieldwood Energy368
Cantium LLC220
Cox Operating LLC92
Onshore Oil Wells
Texas Petroleum Investment Company100
Cox Operating LLC26
Lobo Operating Inc11
Onshore Gas Wells
Texas Petroleum Investment Company10
Lobo Operating Inc9
Fieldwood and Cox had the most exposure during Hurricane Laura as well.

Typhoons Haishen and Maysak: Impact on South Korea’s Export Industry

Typhoons Haishen and Maysak: Impact on South Korea’s Export Industry 800 2000 Diana Peterson

A double whammy of storms hit Japan and South Korea recently: Typhoons Maysak and Haishen made landfall within a day of each other.

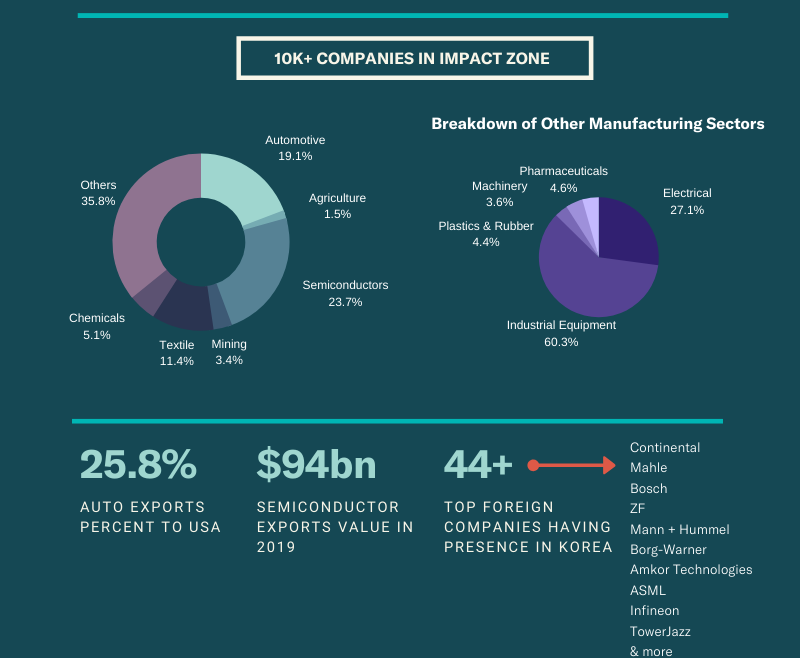
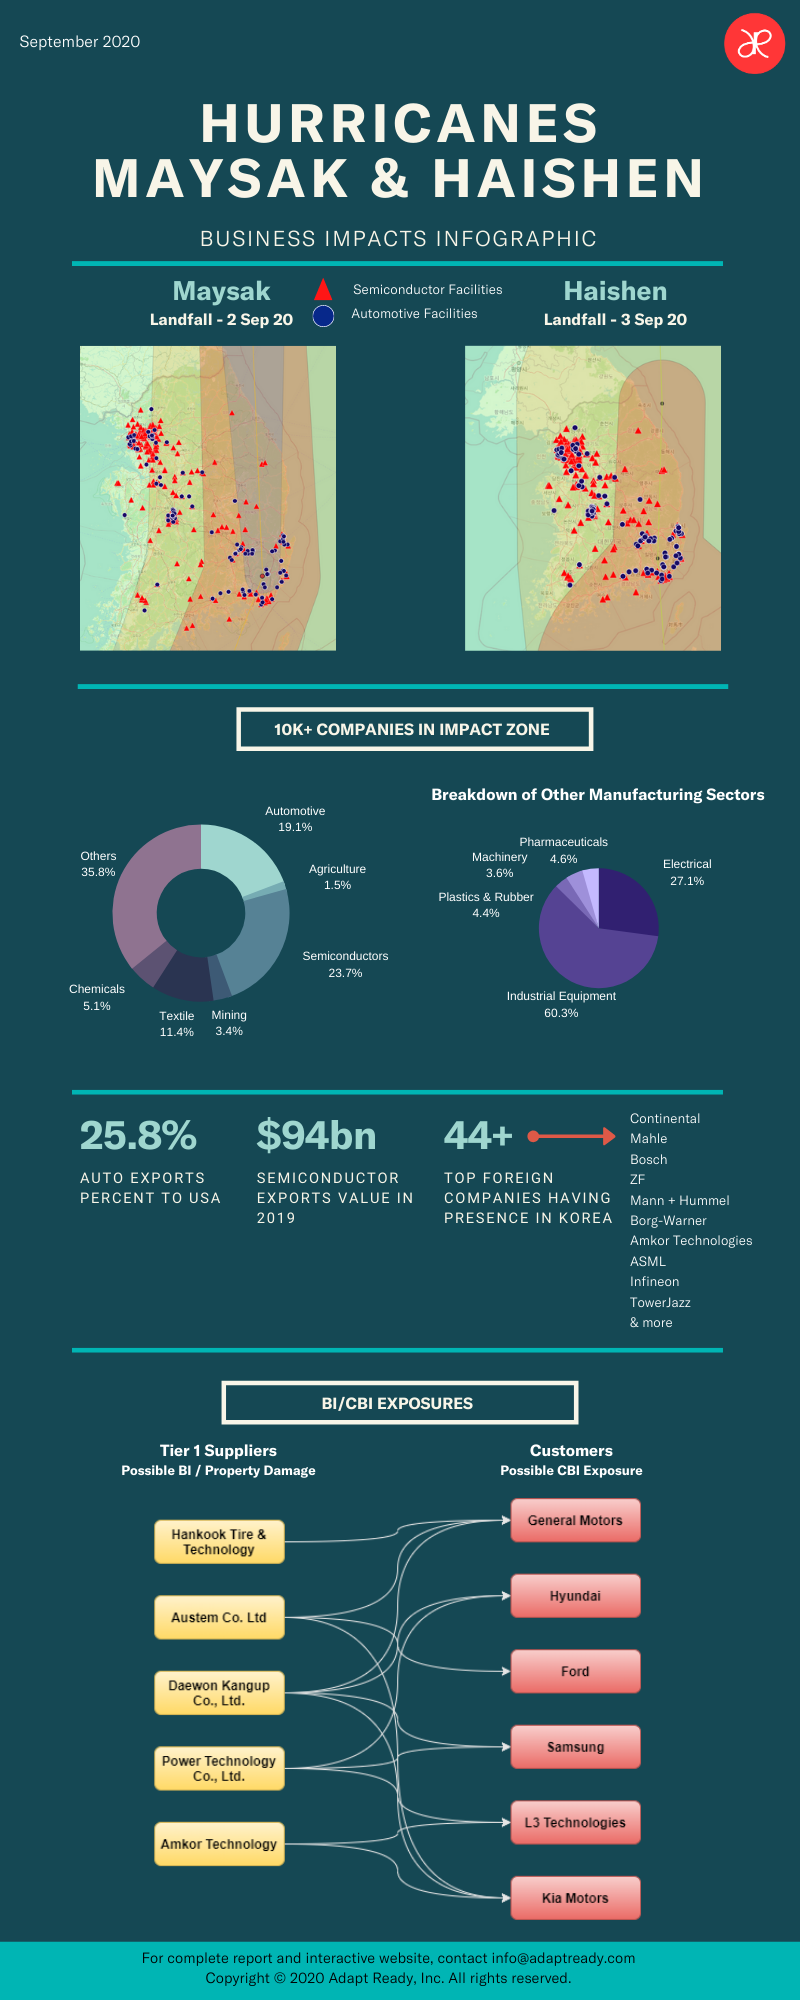
As a result of these storms, South Korea faced a threat to its $110bn+ of semiconductor and automotive export industries according to the latest real-time information gathered by Adapt Ready’s Risk Intelligence Platform. Our initial newsletter tracked Haishen as making landfall as a Category 4-equivalent hurricane and the infographic was prepared with those paths; by the time it reached South Korea, it had been downgraded to Category 2 so the impacts to the identified companies may not be as severe. Nevertheless, the infographic also highlights the accumulation of risk among these industries.

The two main impacted industries are the $23.1bn Automotive parts exports and the more concerning $94bn semiconductor exports industry which currently ranks as South Korea’s largest export industry. Despite the updated path of Typhoon Haishen, they have impacted operational capacity on some of South Korea’s major corporations; and as per our analysis, the companies most exposed to losses right now are Samsung, Amkor, Hyundai, Ford and General Motors, by virtue of their heavy supply chain reliance on South Korea

In the attached infographic you can clearly see how Maysak’s path ran right through the heart of the semiconductor and auto industries in South Korea. Most insurers are able to know the property damage to direct sites of their customers but the impact on lines such as business interruption within the manufacturing sector is impossible to capture without the right tools to assess interconnected risks. They are unable to know or even estimate their BI/CBI exposure, which is paramount during these times. Some of the interesting insights from our risk intelligence platform include:

  • 472 semiconductor companies and 426 automotive final assembly/parts supplier companies were in Maysak’s high impact zone (min wind speeds ~90 Km/h and max wind speeds ~176 Km/h)
    • The same numbers increased to 653 semiconductor and 528 automotive companies when the focus is on high impact zones of cyclone Haishen.
  • Multiple common tier-1 suppliers were in the impact zones of both the cyclones, potentially leading to supply chain issues to bigger companies like Estra Automotive, General Motors, Hyundai, Samsung and Ford.
  • There could be a “double edged” impact to supply chains of raw materials and finished goods, both in automotive and semiconductor industries, causing large exposures.

If you would like more details as to impacts to your specific portfolio in that area or just want to be kept up to date with the real-time impact of the cyclones then please reach out using the details below.

Hurricane Laura: Impact on the Energy sector

Hurricane Laura: Impact on the Energy sector 500 516 adapt ready

The latest real time information is now available for tropical storm Laura, but can this come to the aid of the ailing energy market?

As storm Laura struck the Gulf of Mexico as a Category 4 storm after undergoing a massive intensification in strength in just 24 hours, the insurance industry, as always in these times, is inundated with predictions of losses and warnings from the likes of AM Best and Moody’s of added stress to the balance sheets of their rated insurance companies, already weakened by Covid-19.

With the availability of new technology and powerful analytics tools now though, there is a way for the industry to react with better, more informed decision making.

Let’s take the ever-suffering Energy market, which over the last few years has been hardening due to an increase in losses and a decrease in premiums, so the use of cutting-edge technology is already pivotal in reducing expense ratios – but can that technology help in real time?

Having the right information at the earliest possible time will massively help companies with their reserving, so what information can we gather right now from this data?

Port Arthur, Texas is home to the largest oil refinery in the US. Over 330 offshore drilling platforms are right in the path of Laura’s peak winds, but not all rigs and refineries are equal. Older platforms (pre-2006) generally have a lower profile and therefore more likely to be affected by the predicted storm swells of over 20 feet and understanding how many of these are in insurers’ portfolios is the first step of the analysis.

  • Currently there are 235 older (pre-2006) platforms in the storm affected area.
  • The platforms are owned or operated by a handful of companies that have large exposures, including Fieldwood Energy LLC, Cox Operating LLC and Arena Offshore LP.
  • It is also worth noting from the data that Fieldwood Energy alone owns or operates 238 fixed offshore platforms and thus has the largest exposure.

Modern, floating platforms are designed to be far more resilient to storm surges but any of the above fixed platforms caught in the storm would add more pressure to their owners.

Company Platform Count
Fieldwood Energy LLC238
Cox Operating, LLC102
Arena Offshore, LP39
Talos19
Sanare Energy Partners17
Top 5 Risk Exposures

These companies have properties at a greater risk of losses and knowing this allows insurers the opportunity for better reserving and the ability to do that faster also gives a greater understanding of potential losses.

One of the areas that Real time data can be truly beneficial in times like this is in the potential to have preventative action, which leads to faster processing of claims and not to mention identifying the business interruption impact.

Looking at the infographic we can also see the impact to downstream energy production.  With production already down 84% in the last two days this is going to put pressure on chemicals, machinery, plastics and rubber manufacturing who may have shortage issues.    

The last similar storm that hit this region was Hurricane Rita in 2005, which resulted in $6.4 billion in insured losses

A final point on how underwriting can modernize with this type of data. Traditionally, energy companies have insured their risk exposures on an individual basis, with reliance placed on historical losses to assess risk, usually by considering each class of insurance in isolation. 

Premium, market capacity, deductible and insurable limit are the main drivers, with only limited analytical support undertaken to assess placement outcome and pricing or the insurer’s overall portfolio.

This single view of risk doesn’t take into account the true nature of risk, which is far more complex and includes dependencies within and between risk exposures that can now be better understood by combining data with modern analytical capabilities. Is it not time that underwriting used this available data, gained a complete understanding of the interconnected risks in a portfolio and helped to reduce both exposures and costs in the long term over the traditional and more myopic system?

If any companies on this list are in your portfolio, then we have detailed information that may help and are more than happy to share it; so please do not hesitate to get in touch.

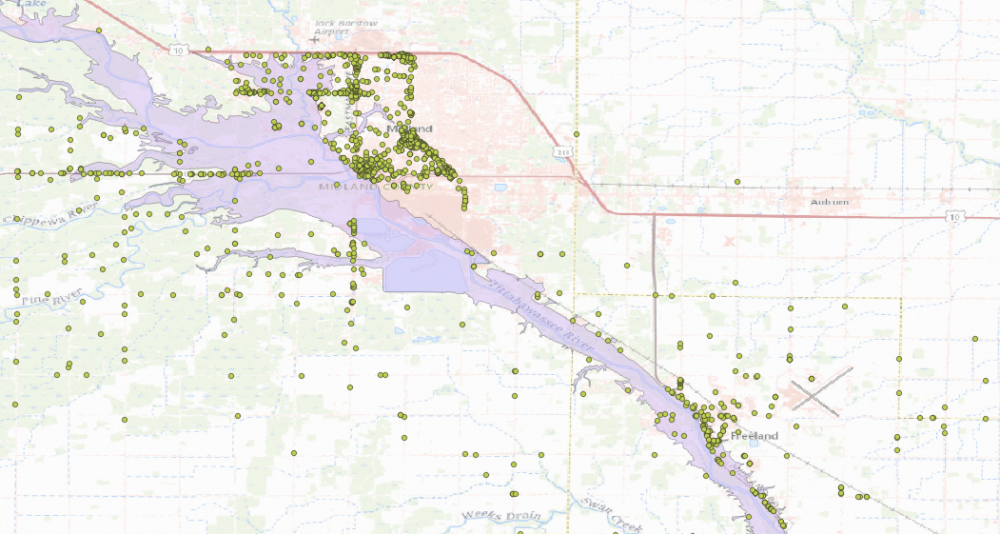
Midland Michigan Flood Impact Map

Catastrophic Flooding in Michigan

Catastrophic Flooding in Michigan 1051 561 adapt ready

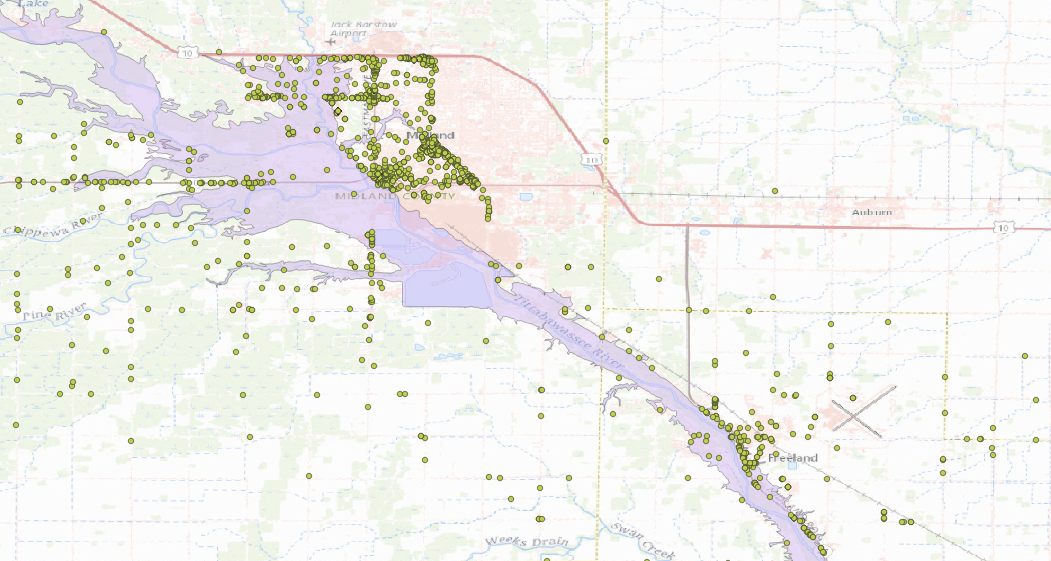
With the breaching of both Edenville and Sanford dams in Midland Michigan, thousands of people are under evacuation orders. The impacted region is also home to hundreds of small businesses ranging from restaurants and grocers to dentists and law firms.

One of the bigger concerns is a Dow Chemicals plant that manufactures plastics and resins, where floodwaters have already reached the plant’s outer boundaries per the New York Times. For a detailed analysis of the potential business interruption and contingent business interruption losses, schedule a demo today.

Technology Helping Source COVID-19 Supplies

Technology Helping Source COVID-19 Supplies 1200 800 adapt ready

As the Coronavirus pandemic continues to spread globally, personal protective equipment and critical care items are in short supply. PPE and healthcare accessories and devices such as ventilators are in great demand to treat patients with COVID-19 and contain the spread of the coronavirus. 

COVID-19 has caused severe disruptions to global supply chains, and one of the industries most affected is healthcare. With more than 3.6 million confirmed cases and at least 254,586 deaths worldwide as of May 5 and growing, according to the World Health Organization, the coronavirus pandemic is the most significant public health emergency in many years.

As an early stage startup that has mastered optimizing public and proprietary data to provide risk intelligence, we have traditionally been releasing reports of business impacts/supply chain disruptions during every major event. While analyzing the business impacts of COVID-19 on pharmaceutical industry, we realized the disconnect between the supply and demand of sourcing PPE & CCE around the world.

So, we decided to use the external data capturing capabilities of our platform, powered by Big Data/AI, to address this very pressing need and built an application that lists manufacturers and retailers that provide all the necessary equipment identified by the WHO as necessary for battling COVID-19. The app is free to use for governments, states, cities, hospitals and private distributors, making it extremely easy to locate contact information and reach out to manufacturers/retailers at their fingertips.

With COVID-19 cases still on the rise, particularly in the United States (1.1 million+ cases and over 70,000 deaths as of May 5), PPE, CCE and healthcare accessories and devices are needed more than ever before.

  • With little help from the federal government, states are looking to the open market, where they are met with demand pricing and forced to bid against each other.
  • The open market can also be murky, subject to scams and counterfeit products. To prevent this from occurring we have ensured that they are trusted and approved by US and EU regulators (all manufacturers are FDA-approved).
  • Adapt Ready bridges this disconnect between supply and demand of sourcing PPE/CCE by breaking through the noise of a complicated and difficult market to put consumers and organizations directly in touch with manufacturers and retailers to combat soaring prices and empower state/local governments, NGOs, hospitals and others in the healthcare ecosystem to collaborate and take the buying process into their own hands.

This is an app for social good and free to use. While originally designed for Apple iOS and Google Android platforms, due to the pandemic, they are only launching apps from government organizations, NGOs and healthcare institutions. For now, we have made it publicly available at https://covid19.adaptready.com. We are seeking partnerships with government/NGOs and healthcare organizations to launch the app – and welcome you to reach out for more information. Please share this with your network and help spread the word, so we can collectively have an impact on fighting COVID-19.

About Adapt Ready:

Adapt Ready’s ground-breaking risk intelligence platform delivers new data insights and fills in key gaps with external data, enabling our customers to better manage operational and financial risks, and to enhance their growth and profitability. With our platform, organizations can gain insights from external data tailored to specific situations before, during and after a crisis:

  • Before: Plan for risks by uncovering as many hidden risks as possible
  • During: Mitigate the impact – as events unfold, new data emerges and can inform decisions to reduce the event’s impact
  • After: Adapt to new conditions and refine future business direction